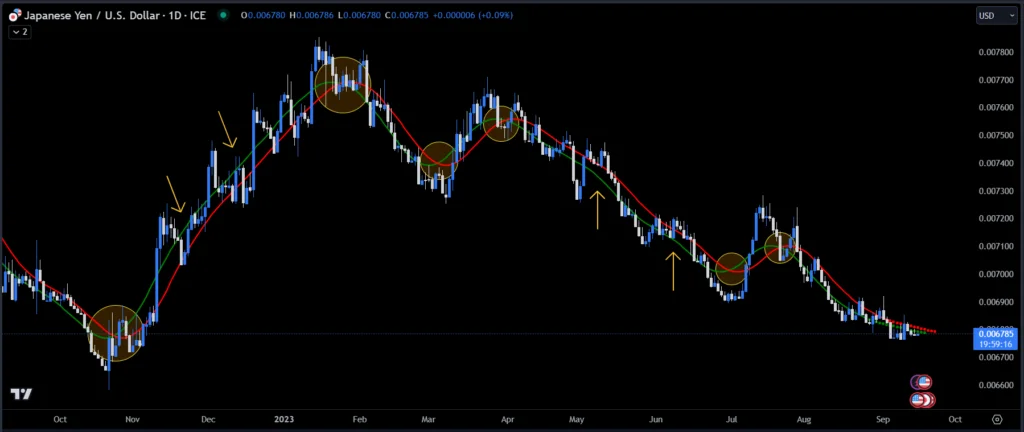
What Is a Triangular Moving Average (TMA)?
It’s a type of moving average that smooths out the price data by creating a triangular weighted average. Unlike simple moving averages that give equal weight to all data points, TMAs assign more weight to the middle data points and less weight to the outer ones, forming a triangular distribution of weights.
How Is a Triangular Moving Average Calculated
It’s really not as difficult as it sounds.
- First, we choose a period n for the TMA.
- Then we take the sum of the prices over the chosen period.
- Apply weights to each price, with the middle price receiving the highest weight and the outer prices receiving progressively lower weights.
- Finally, we divide the sum by the ‘sum of the weights’ to get the TMA value.
Why Use TMAs – Some of the Benefits
It’s really not as difficult as it sounds.
- Smoothing: TMAs reduce noise and volatility in the data, making trends more apparent.
- More Responsive: They react faster to recent price changes compared to simple moving averages.
- Less Lag: TMAs have less lag compared to other types of moving averages, making them more suitable for trend-following strategies.
- Centrality weighting: TMAs give more weight to recent data, which can be advantageous in fast-moving markets.
What is ‘Lag’ in Moving Averages
y^t+1 = (yt+yt−1+…+yt−m+1) / m
Let’s look at this formula for a minute. It’s a simple arithmetic formula used for forecasting. While it is easy to understand, one of its properties may not be obvious. That is the inherent lag. What’s the lag associated with this technique? Think it through. The answer is (m+1)/2. For example, say you’re averaging the past 5 values to make the next prediction. Then local changes will yield a lag of (5+1)/2=3 periods. If you choose a window of m, then the prediction y(t+1) is based on m previous values and thus the lag is m. The lag increases as you increase the window size for averaging.”
So, in this example, the forecast value is an arithmetic mean: or in plain English: Taking the sum of all observations, and dividing the sum by the number of observations, resulting in a “Simple Moving Average” (SMA). Another way to come to the same result, is to multiply all observations by 1/𝑛 and sum those products.
Many moving averages are trend-following or lagging, because they are based on past prices. The longer the period for the moving average, the greater the lag.
Why Are Some Pitfalls of TMAs
- Whipsaws: Like other moving averages, TMAs can generate false signals during ranging or choppy market conditions.
- Delayed Signals: While less laggy than some other moving averages, TMAs do still produce delayed signals during rapid price movements.

What Is Extrapolation
The second part of this strategy is utilizing extrapolations, or projections. In a nutshell, extrapolation is the process of estimating values beyond the range of known data points. In trading, it involves extending a trend or pattern into the future to predict potential outcomes.
How Is Extrapolation Applied and Used
This is a bit more advanced for this blog. There are many ways to employ and calculations to use. Many extrapolation methods vary depending on the underlying data and the desired forecast. Some common methods include linear extrapolation, exponential extrapolation, and polynomial extrapolation. In this strategy I use a basic linear formula.
What are Some of the Benefits
- Extended Forecasting: The obvious benefit of course is that extrapolation allows you to project price trends beyond the available data, aiding in long-term planning and decision-making.
- Simple Implementation: Many extrapolation methods are straightforward to apply and understand, which makes them easy to implement.
- Identifying trends: It helps in recognizing and following trends over an extended period of time.
What are Some of Its Faults
First off let’s be clear, no one can foresee the future, especially in the markets. Extrapolation may give you an indication of what may happen, never what will happen. Now, what are some other major drawbacks of extrapolation?
- Risk of Error: Extrapolation relies on the assumption that past trends will persist, which do not always hold true, especially in rapidly changing markets.
- Sensitivity to Outliers: Extrapolation can be sensitive to outliers or extreme events in the data, leading to inaccurate forecasts and results. Be careful!
Now the Strategy: Strategy: Two TMA Crossovers with Extrapolation
I am utilizing two TMAs with different periods (that can be adjusted). One that is a shorter-term TMA, the other a longer-term TMA. When the shorter-term TMA crosses above the longer-term TMA, it will indicate a bullish signal, and a potential upward trend. Conversely, when the shorter-term TMA crosses below the longer-term TMA, it will indicate a bearish signal, and a possible downward trend. I will apply extrapolation to extend the TMA signals into the future. I will also program the ability to adjust these values. By extrapolating the crossover points, traders should be able to anticipate potential future trend changes and adjust their trading positions accordingly.

Now, let’s check out the code!
What Is Extrapolation
The second part of this strategy is utilizing extrapolations, or projections. In a nutshell, extrapolation is the process of estimating values beyond the range of known data points. In trading, it involves extending a trend or pattern into the future to predict potential outcomes.
